Scrapbook: a hazardous waste management Tool
Context: Within the general domain space of waste management, research and address a potential problem that could possibly be addressed with a responsive web interface.
Date: November - December 2018 (3 weeks)
Key Concepts: Guerrilla research, customer journey mapping, storyboarding
Tools Used: Adobe InDesign/XD, Sketch/Figma, InVision
Collaborators: Minji K. | Sean P.
Some initial outline of how we were going to go about dividing our user groups.
Defining the DOmain space
Within the given domain of Waste Management, we selected a more specific area of waste management to begin guerrilla and secondary research on. We chose to focus on hazardous waste management.
However, even hazardous waste management is a very broad domain with many perspectives and stakeholders involved. We identified three major groups of users: individuals, small groups (such as smaller organizations like start-ups, family-owned companies, etc.), and large organizations (such as university research and science labs, hospitals, and waste management organizations).
We decided to tackle the problem of hazardous waste management in research labs at places like hospitals and universities.
secondary research
Now that we have decided a targeted area within waste management for our project, narrow the scope of interest to address the goals of a specific organization. Conducting secondary research will help with understanding the context and current status of our problem space
Because hazardous waste management was a new concept to us, we began our secondary research online. We began by looking up just “hazardous waste management”, and from there we looked up more specific topics like “chemical hazardous waste”, “hospital waste management”, and more. We settled on the chemical hazardous waste management process, specifically looking at the lengthy, intricate process that involves three major user groups that we define later on.
Despite secondary research, it was still a bit difficult to find targeted organizations and people to talk to since hazardous chemical waste management involved so many groups. The main insight we derived from this step was the identification of the 3 entities we targeted for guerrilla research:
Waste Generators (Client)
Clients’ Waste Management Coordinators
Waste Management Companies
Guerrilla research
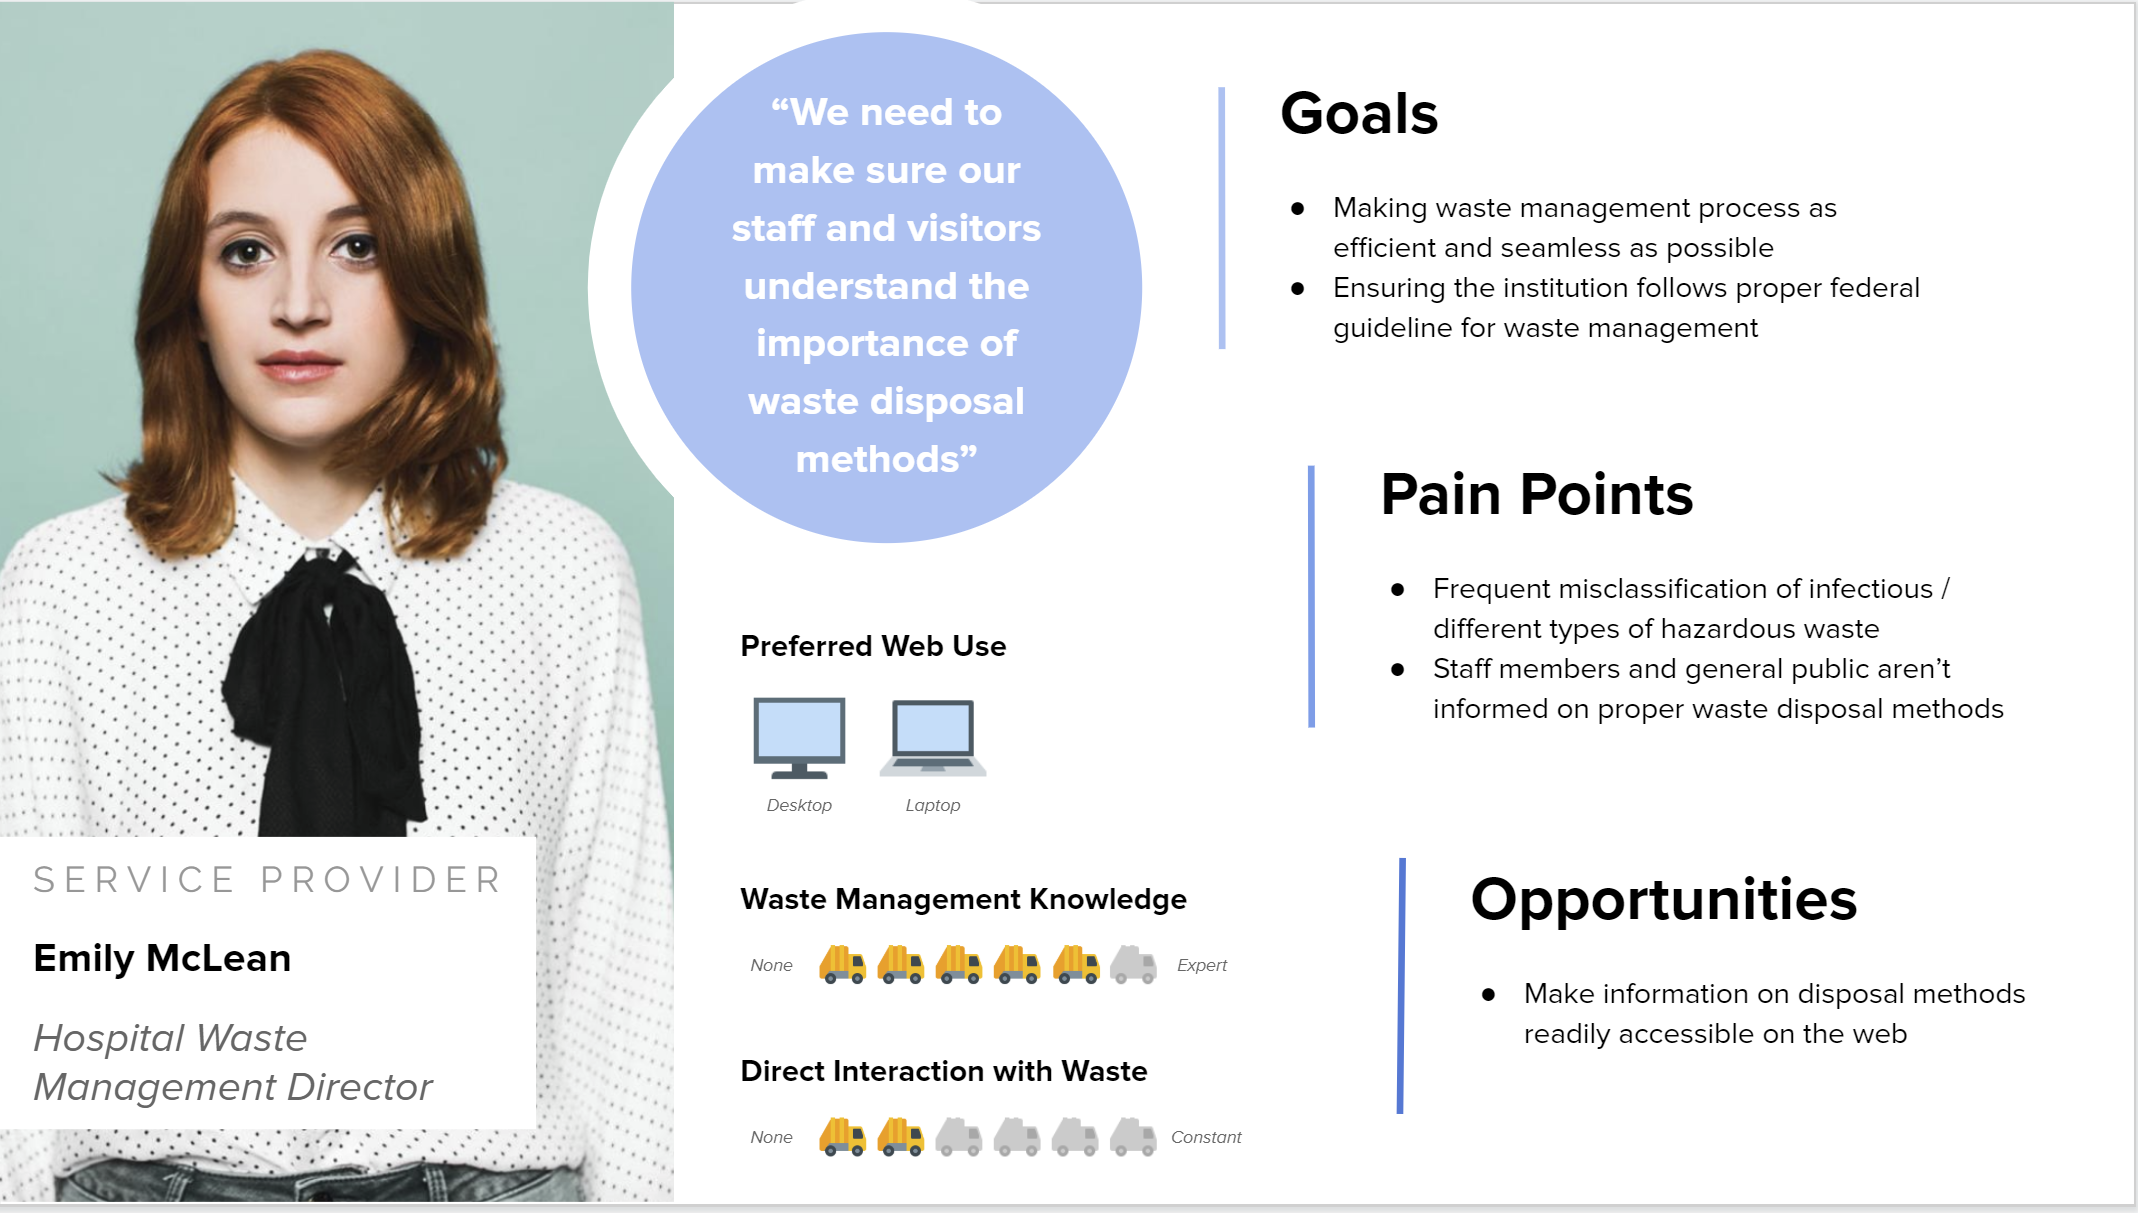
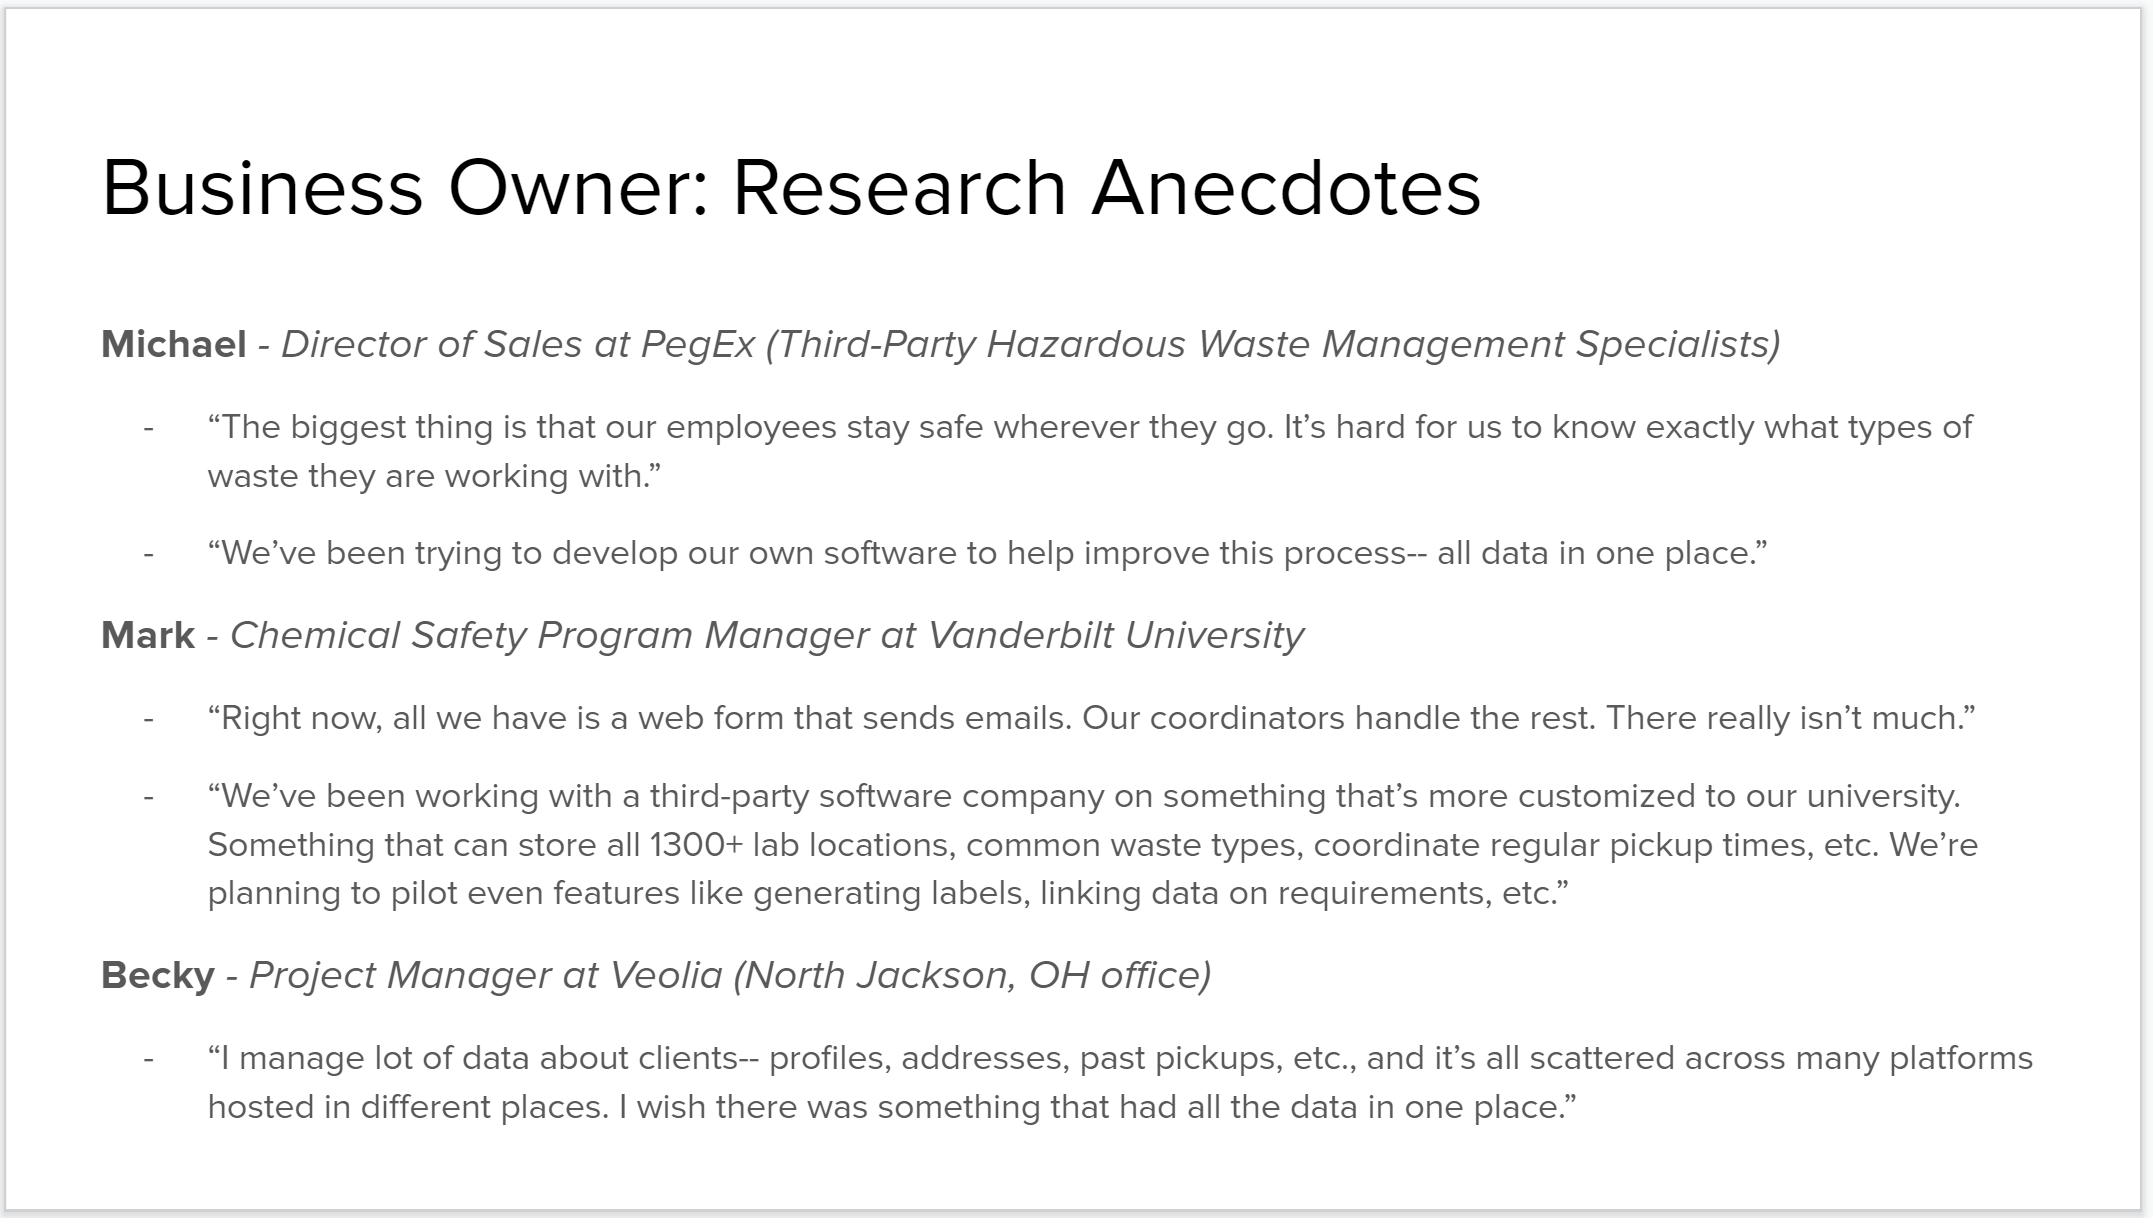
We conducted guerrilla research to learn about goals, pain points, and opportunities for three stakeholders whom we will be later creating personas for. The findings were collected in an informal report that captures the pain points and opportunities for each stakeholder.
We each went out into the community and interviewed several individuals to represent the 3 groups we identified:
Clients’ Waste Management Coordinators
Senior Safety Manager in Chemical Waste at Vanderbilt University
Coordinator of Waste Management at the University of Florida
Directors of Waste Management Divisions
Director of Waste Management at UPMC
Staff Member at the Environmental Health and Safety Department at UPMC
Waste Management Companies
Director of Sales at PegEx (Third-Party Hazardous Waste Management Specialists)
Chemical Safety Program Manager at Vanderbilt University
Project Manager at Veolia (North Jackson, OH office)
The most important information we gathered in this phase was how manual and complex the data handling process was.We also noticed that the manager had a lot of moving pieces to manage.
Customer journey mapping
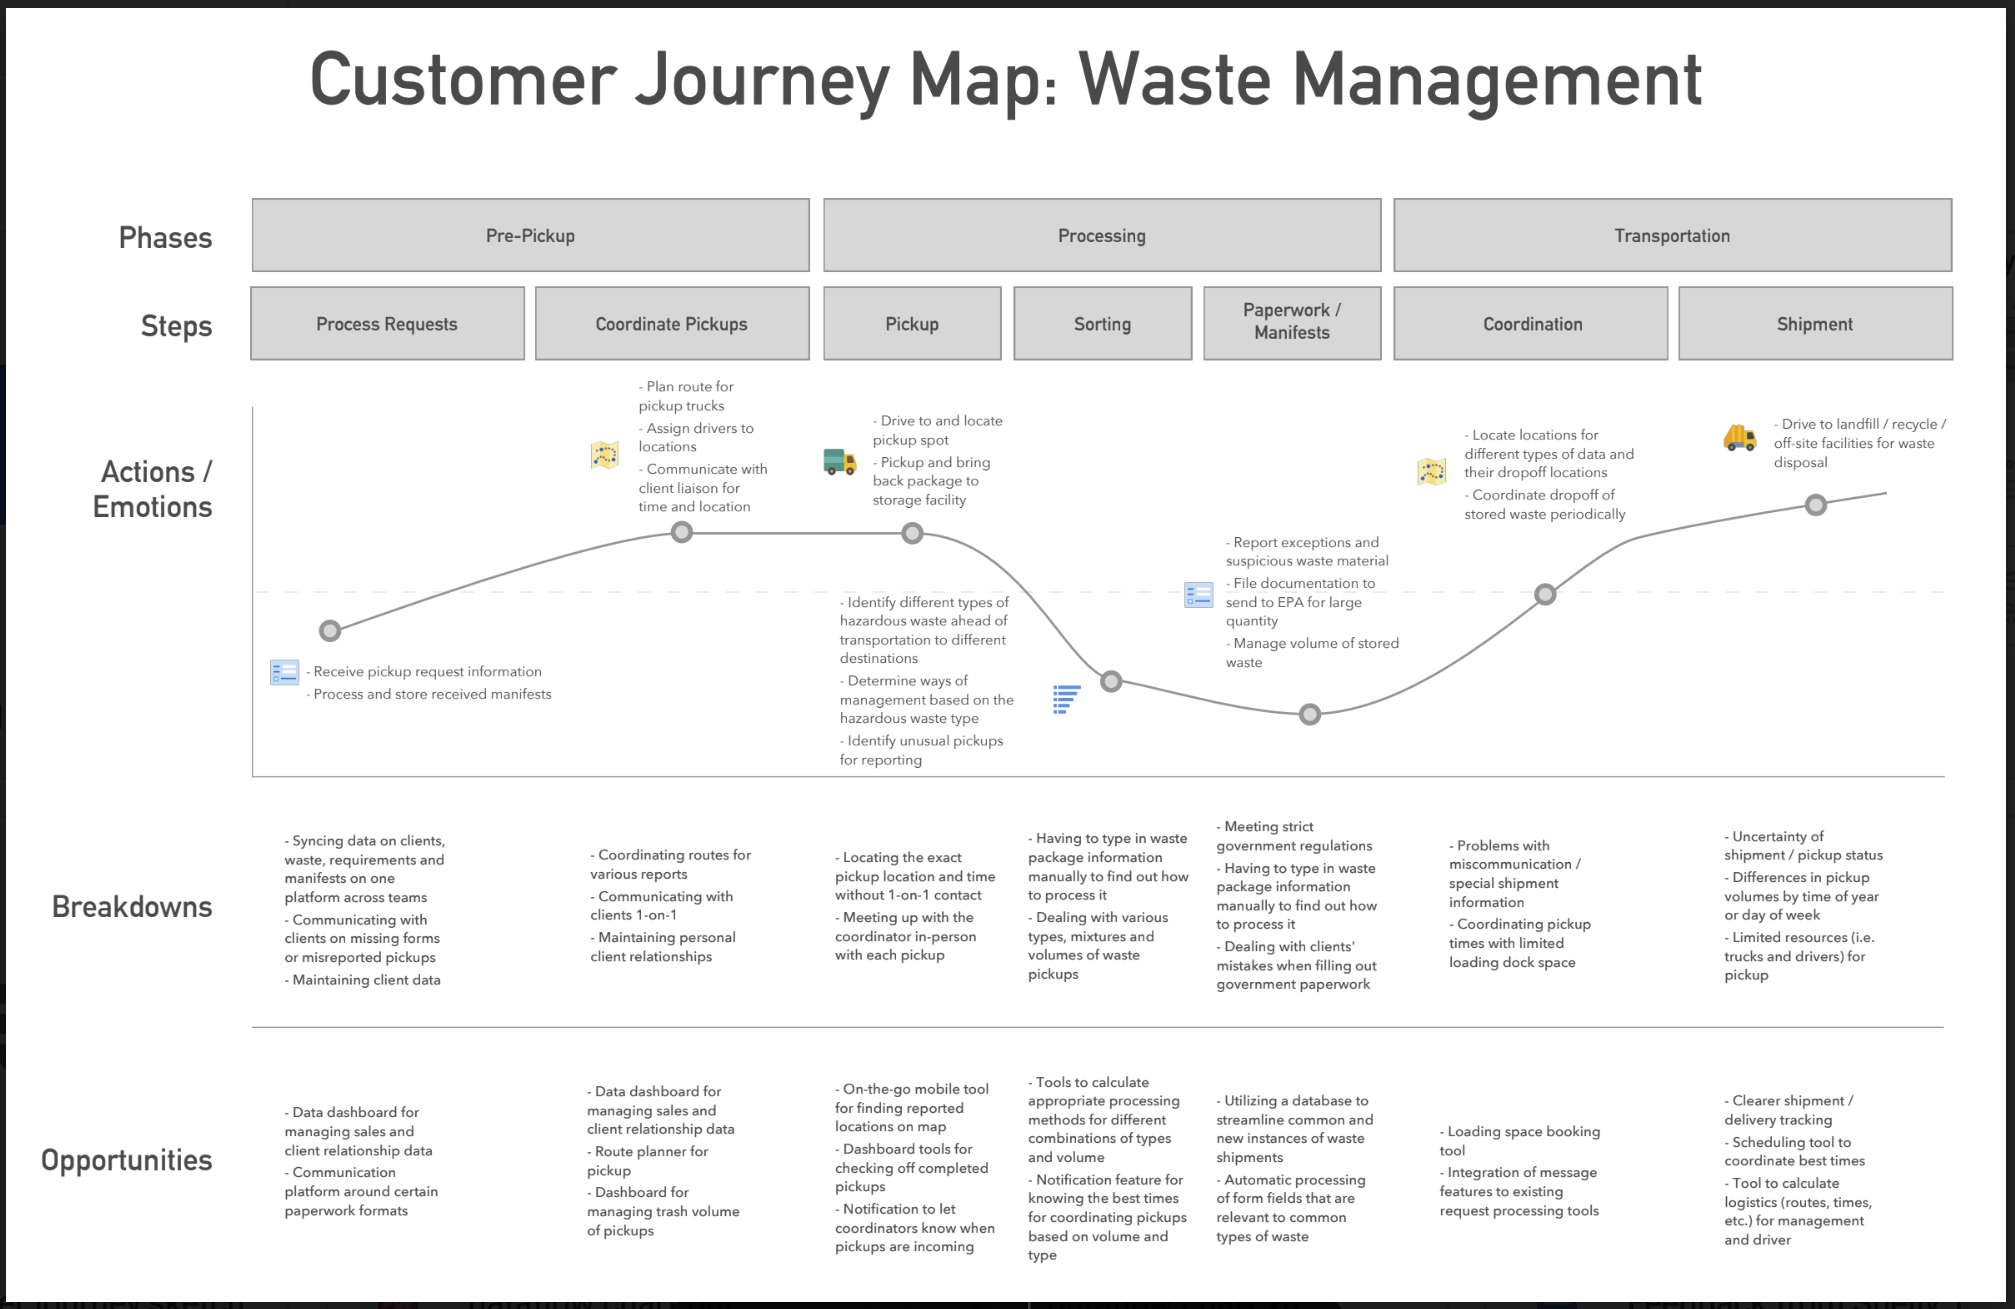
We listed each of the responsibilities for the three rough personas we had created and identified at which steps there was a “handoff” of responsibility from one user to the next.
This was the first time I’ve done a customer journey mapping and it was confusing at first because I think we jumped too quickly into trying to find a solution, rather than identifying the high/lows of our users.
We made multiple drafts of our customer journey maps, one that looked more like the usual mapping with a graph that followed the emotions of our users but also one that tracked more of the process, rather than our users.
Looking back, there was a lot of room for improvement for these journey maps. Some things that we could have done but have also learned are:
Clearer titles - it’s not immediately apparent who or what these journey maps actually follow
More visual representation - there are a lot of words! Being concise would be very helpful here to try and summarize/collect the main points
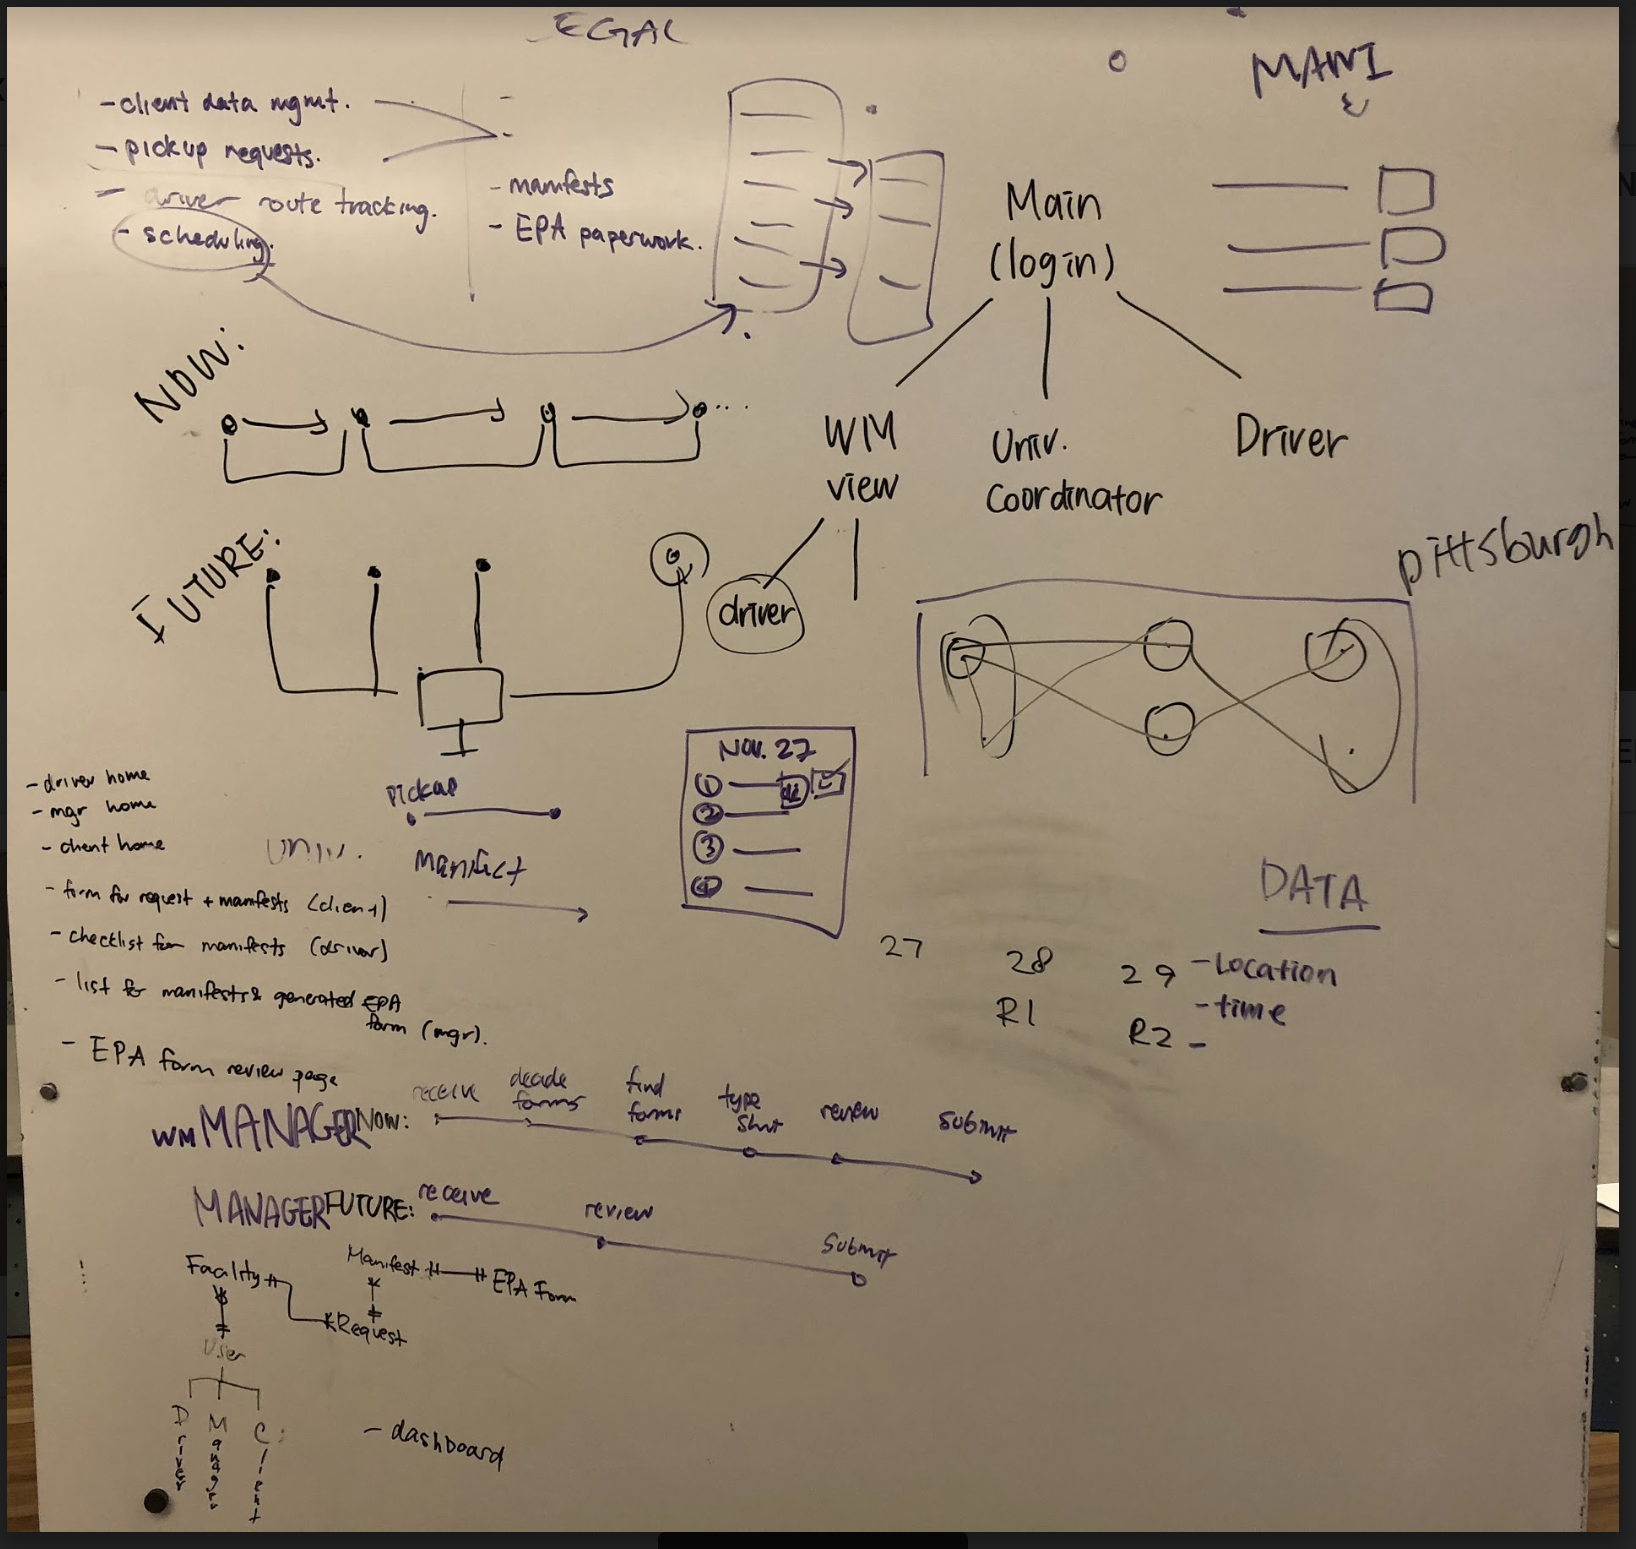
Understanding the purpose of a journey map - part of the confusion in the third map (far right image) was that we were so focused on highlighting the confusing and inefficient process of how information is passed from user to user—which isn’t what the customer journey map is about.
Even though this wasn’t a customer journey map, it still became part of our arsenal and helped us move towards the solution
Storyboarding
We came up with breadth of scenarios for each persona, where the pain points might occur.
Through this process, we were able to translate needs and vague design ideas into concrete solutions. Furthermore, we started generating ideas about how to utilize responsive web as a solution to the problem scope we have identified.
After creating storyboards, we engaged in multiple rounds of speed dating to make sure our solution adequately addressed the problem in each scenario (the validation principle).
The two most popular storyboards were ones that:
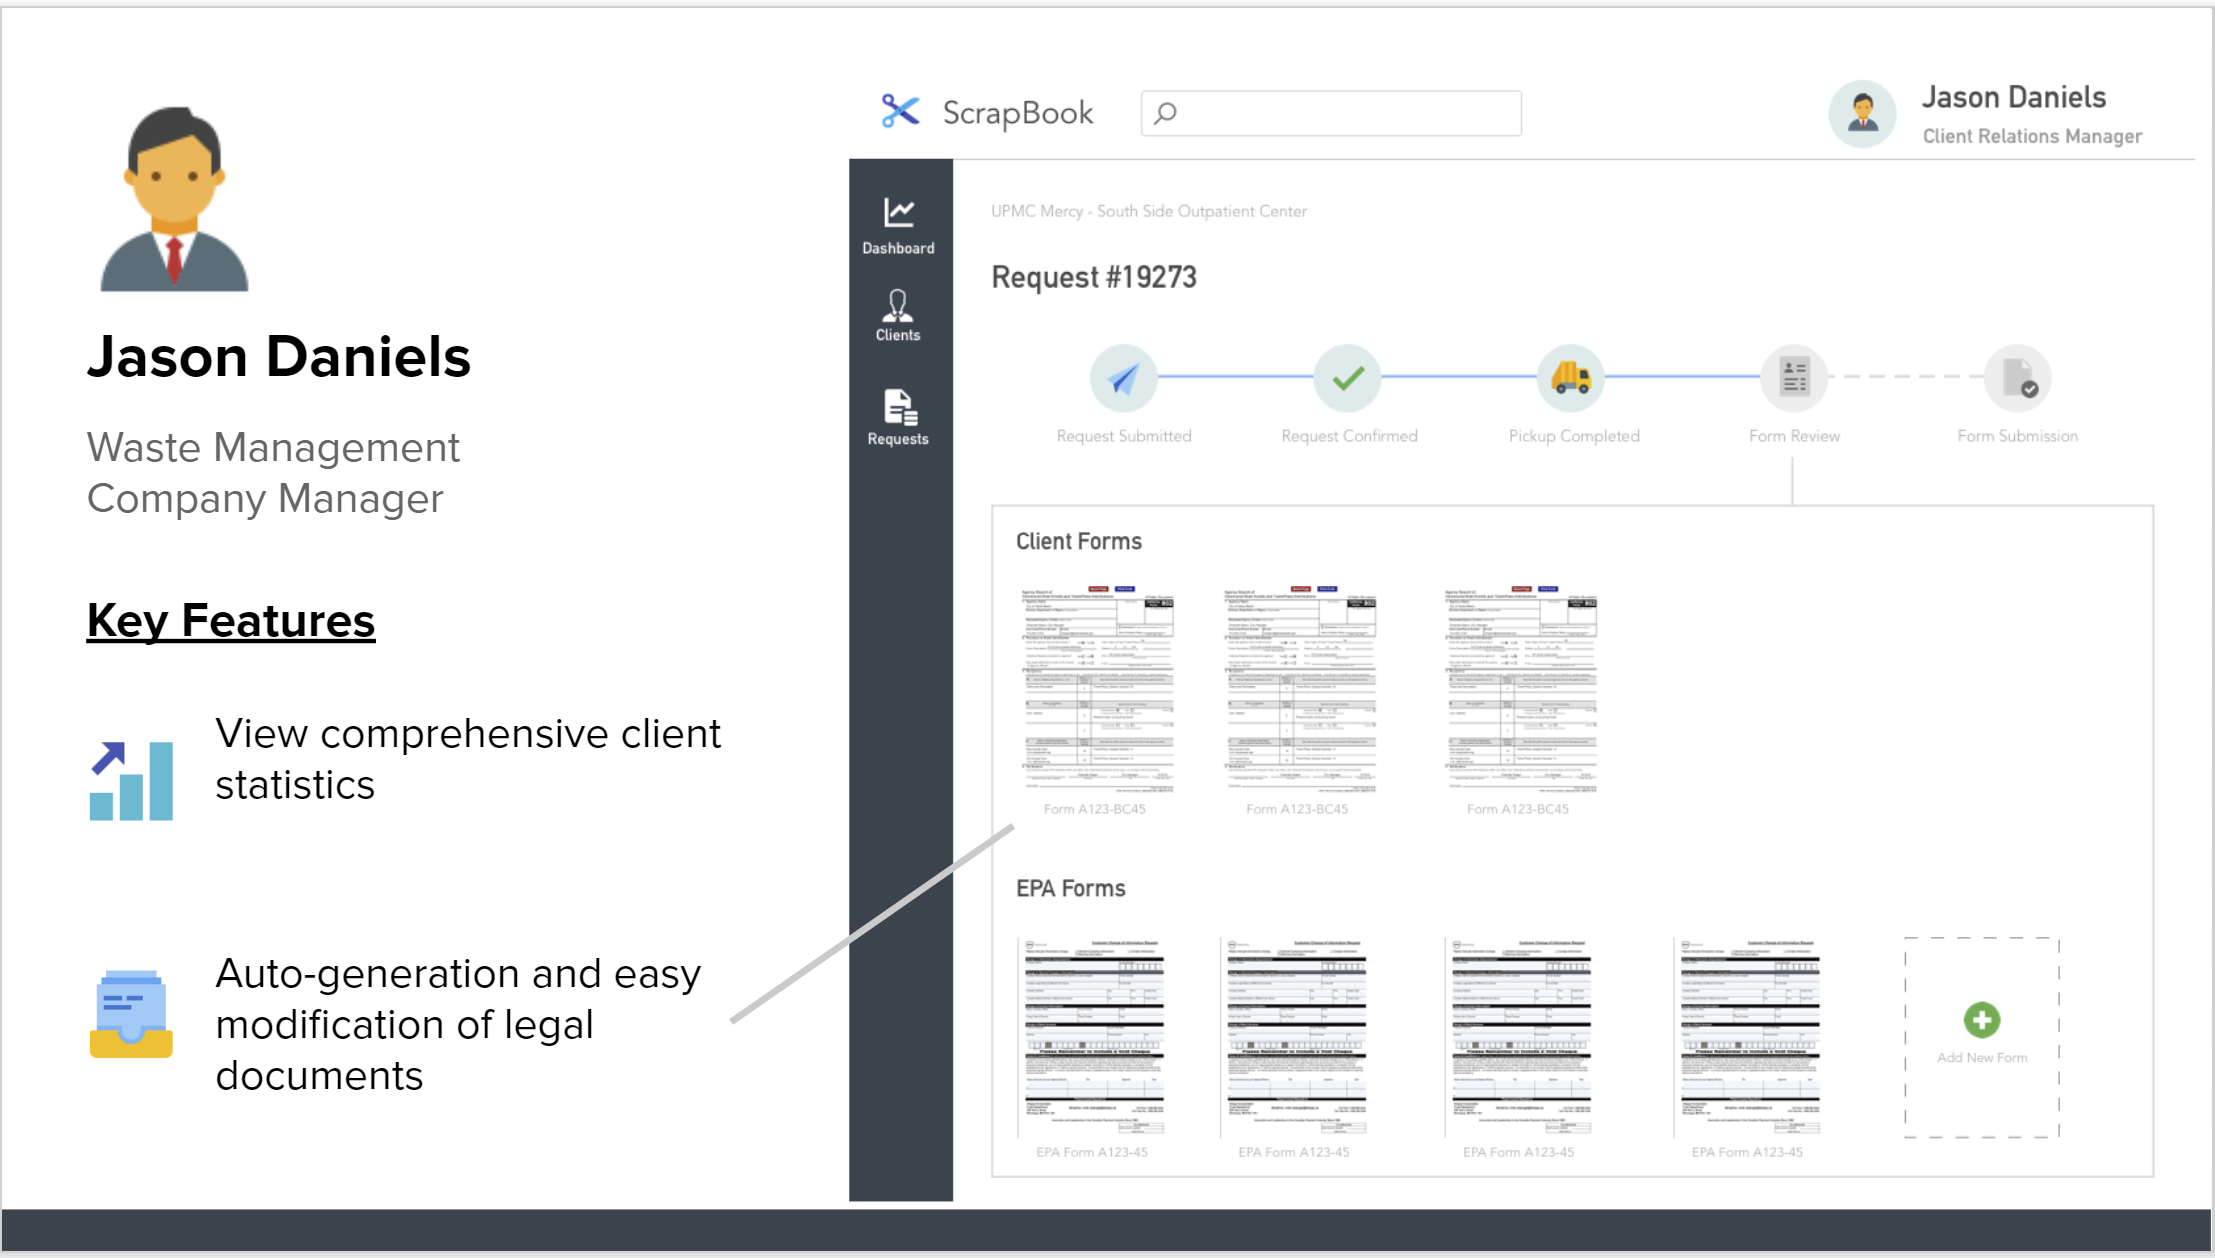
Helped the waste management companies’ managers store client data, process client paperwork, and create EPA paperwork
Helped generate driver routes to handle all waste pickup requests and displayed pickup insights on an admin dashboard
Storyboarding and speed dating is hard when you don’t know what you’re doing. In earlier iterations, we tried to come up with lots of stories but those were unsuccessful because they were either too broad or too convoluted. Which lead to another problem when speed dating with laymen users: no one had any domain-knowledge! That made it tough to determine whether or not our solution was actually viable and efficient.
Planning our Screens
To create our screen map, we first tried to define the different entities that exist in the system’s database, and then thought about the different pages that would be necessary to display all the information that would make the system viable.
The final screen map also helped us define whether certain screens would require different versions depending on each user’s authorization and permission to view certain data.
While creating the initial sketches, we found that the definition of the content and the specific features of the tool were crucial in demonstrating the value proposition. For example, search was not a feature we had previously considered, but we found that it would help the user greatly in navigating through the process.
Wireframes and low/mid-fidelity prototypes
One of the main things we focused on was creating value. (InVision Prototype)
Reflection
This project was quite the experience for a number of reasons because I think I faced more challenges in this one than in previous projects. There were also a lot of new things to learn!
Some key takeaways that I got from this project include:
Conduct each step/method with purpose: it was really tempting to just think about the solution and jump straight to wireframing. While I think we still ended up being solution-oriented, it was valuable to go back and reflect on why we needed to do things like customer journey mapping and why we needed storyboarding. There were some insights that we found that we wouldn’t have otherwise because of it. However, it is equally as important to not go through with a method purely for the sake of a method. Move forward with intent and purpose.
Documentation is key: it’s hard to remember everything you and your whole team has done! Write it down, take a picture—that way, you can always refer to it to help you with your process.
Translating pain points to value to design takes deliberate effort: this is all about the process and making sure to communicate clear goals with your teammates.
Research in new domain space can be challenging but exciting: I knew absolutely nothing about hazardous waste management but because of this project, it was interesting to learn about the kind of people, work, and process involved with this domain. The more you know and knowledge is power!


